


Tutorial videos
A comprehensive set of tutorial videos is now available to allow for efficient daily self-training.
The videos and their corresponding data are attached and are specific to the NVGate software platform and our other OROS software solutions. The videos are accessible here and on the OROS Youtube channel.
Additionally, the Tutorials explorer enables offline access to the short step tutorial videos as well as other features.
Acquisition sequence: Full tutorial
How the acquisition sequence can be used to automatically update a set of settings such as Label, Node, Direction…?
This is very useful for modal acquisition for example.
Acquisition sequence: Introduction
How the NVGate sequencer can be used to update settings such as degree of freedom for modal purpose.
Acquisition sequence: Step 01
Create a sequence
This video shows how to create a sequence from a scratch to update measurement settings.

Acquisition sequence: Step 02
Import a sequence
This video shows how to import an Excel sequence into NVGate.

Acquisition sequence: Step 03
Measurement with a sequence
Once measurement is completed, the active sequence will update a set of settings such as Label, Node, Direction… Measurements are also labeled from sequence, as shown in this video.
Acquisition sequence: Tip
Automatic measurement with a sequence
How to get a fully automated sequence of measurements.
Basic operation
How to analyze an imported sound and how to export results?
It compares the resolution of FFT spectrogram and auditory spectrogram, and shows how to use harmonic cursor.
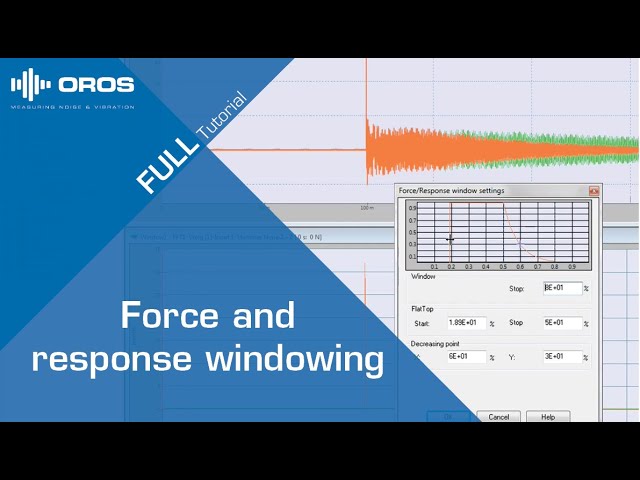
Force and response windowing: Full tutorial
How to build a setup using the force and response window?
In most cases uniform windowing is preferred but sometimes force/response windowing is required.

Force and response windowing: Introduction
This video explains the advantages of using force and response windowing for impact test.

Force and response windowing: Step 01
FFT settings
In most cases uniform windowing is preferred but sometimes force/response windowing is required. This video shows how to change the type of windowing used in the FFT plug-in.

Force and response windowing: Step 02
Add layout
Before setting up the response and force windowing, one has to overlay the raw time block and the weighted time block, as shown in this video.

Force and response windowing: Step 03
Set the response window
The real time view allows to visualize how the windowing affects the FFT processing and to adjust the settings for a better damping estimation, as shown in this video.

Force and response windowing: Step 04
Set the force window
The real time view allows to visualize how the windowing affects the FFT processing and to adjust the settings for a better damping estimation, as shown in this video.
How to concatenate two arrays
How to automatically concatenate two partial circular arrays via merging two projects.

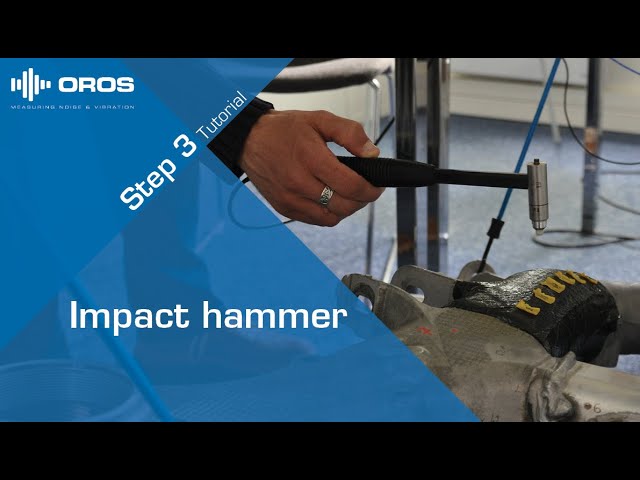
Impact hammer: Full tutorial
How to build a setup for impact test measurement and create an automatic report.
Find also some tips to make your measurement easier. The FFT plug-in is used. The measurement is triggered on the hammer impact using an edge detection event.

Impact hammer: Introduction
This video shows the important results that guarantee a good impact hammer metrology.

Impact hammer: Step 01
Select inputs
How to setup the input table with hammer and accelerometers and how to enter degrees of freedom, set up the sampling frequency

Impact hammer: Step 02
Display and save results
How to display and save the key results (coherence, FRF, autospectrum and triggered block) to monitor the quality of impact tests in real time.
Impact hammer: Step 03
Set the trigger
How to trigger a FFT analysis on an impact hammer using an edge detection event.

Impact hammer: Step 04
FFT settings
How to set the FFT plug-in to properly compute FRF, coherence and others. It is also shown ergonomic features such as accept mode.
Impact hammer: Step 05
Check the saved results
Basic results for modal purpose are FRF and coherence. This video shows how to check that the results will be properly saved before starting numerous measurements.

Impact hammer: Step 06
Update the DOF
Before each new impact location, node and direction (DOF) have to be updated. This video shows how to manually setup DOF easily.

Impact hammer: Tip 01
Display the current block
When time blocks are long because of high resolution requirement, it is convenient to know if the impact has trigged the FFT analysis thanks to a progress bar.
Impact hammer: Tip 02
Set the threshold
During a structure probing, surface stiffness can change (stiffer and softer). Therefore, it is necessary to adjust the impact threshold for triggering FFT.

Impact hammer: Tip 03
Perform an autorange
During a structure probing, force or response can considerably change. Autorange allows to adjust the range peak automatically to optimize amplitude resolution.

Modal analysis: Advanced topic 01
Tip selection
How to select the right hammer tip regarding the frequency range of interest?
Modal analysis: Advanced topic 02
Reciprocity test
How to evaluate the sensor influence through the reciprocity test?
Modal analysis: Full tutorial
How to do modal analysis
From measurement setup and data acquisition, ODS animation, modes identification with different methods, real modes display, curve fitting check, MAC validation, to COMAC analysis.
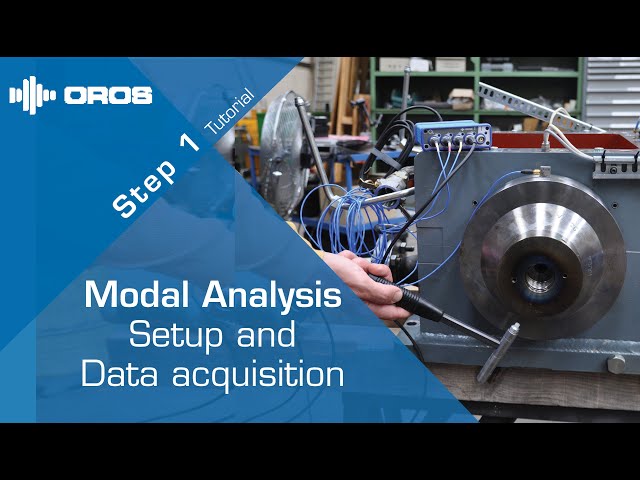
Modal analysis: Step 01
Setup and data acquisition
This video shows how to setup the measurements and acquire data for modal analysis.

Modal analysis: Step 02
ODS animation
This video shows how to animate deflection shapes in frequency domain.

Modal analysis: Step 03
Modes identification
This video shows how to identify the modes with Narband and BroBand methods via CMIF and stability diagram.

Modal analysis: Step 04
Real modes display
This video shows how to display real modes, used to compare experimental and simulation data.

Modal analysis: Step 05
Curve fitting check
This video shows how to compare the measured data to the estimated data by curve fitting.

Modal analysis: Step 06
Auto-MAC validation
This video shows how to check the orthogonality of modal vectors by auto-MAC.

Modal analysis: Step 07
Cross-MAC validation
This video shows how to validate the modes obtained from different methods by cross-MAC.

Modal analysis: Step 08
COMAC analysis
This video shows how to choose the most reliable results with the help of COMAC analysis.
Monitoring Solution: How to setup for trending and alarms?
This video shows how to setup data collection for trending, and setup alarm triggering conditions and actions by using M-Logger module.
Monitoring Solution: What can you do after being alerted?
After receiving alert notification, how to perform initial troubleshooting with trend analysis, and download recorded time signal for advanced diagnostics with OROS Monitoring Solution, M-View module.
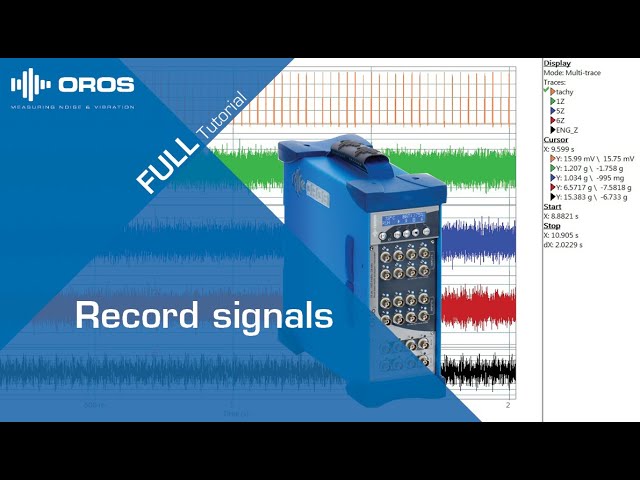
Record signals: Full tutorial
How to perform a signal recording in 5 steps.
In this example, the recorder mode is "start to stop": the user starts and stops manually the recording. Other modes are available (Start to time, time to stop).

Record signals: Introduction
This video explains the advantages to record signals for further analysis.

Record signals: Step 01
Select inputs
How to select the transducers used. In this example, we connect 3 microphones.

Record signals: Step 02
Sampling frequency
How to adjust the sampling frequency to 51.2 kHz in order to have a bandwidth of 20 kHz.

Record signals: Step 03
Activate the recorder
How to activate the signal recording.
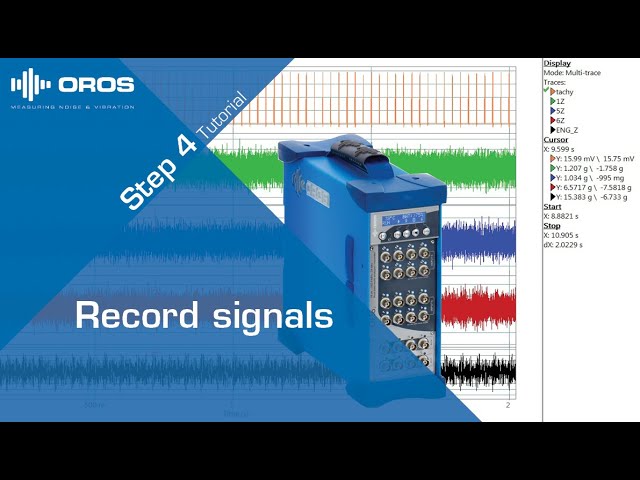
Record signals: Step 04
Display signals
This video shows how to display the signals during the acquisition.

Record signals: Step 05
Recording
How to start and stop a recording. The recorder mode is "start to stop". Other modes are available (Start to time, time to stop).
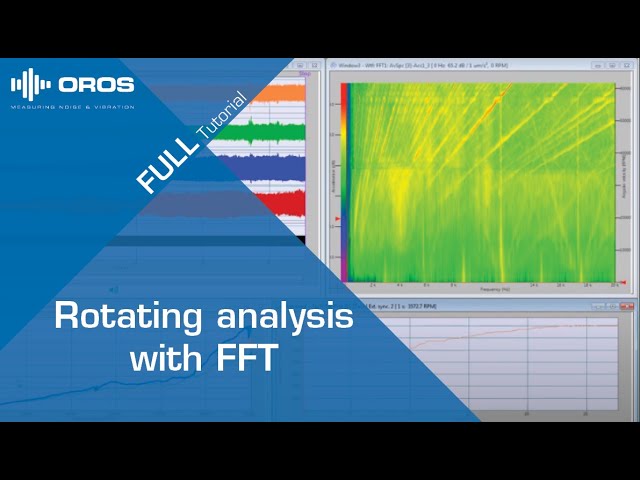
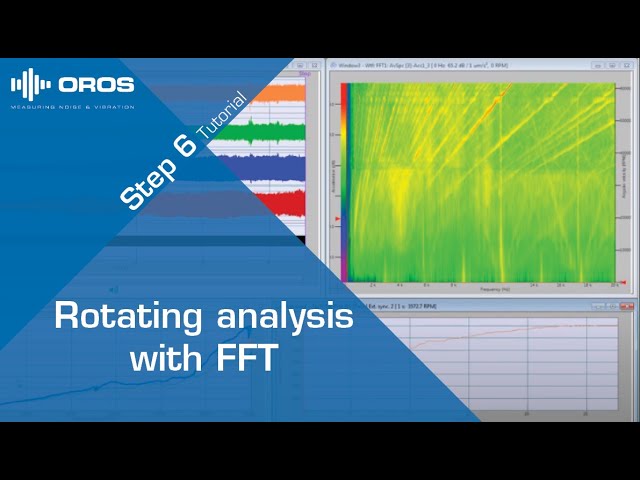
Rotating analysis with FFT: Full tutorial
How to build a setup for online rotating analysis using the FFT plug-in
and how to post-analyse the recorded signal and perform an order extraction from the time-frequency waterfall.
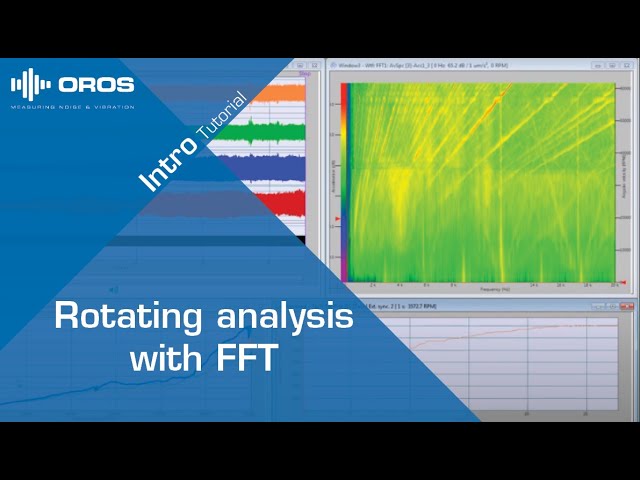
Rotating analysis with FFT: Introduction
How the order tracking can help to make a diagnosis on a rotating machine.

Rotating analysis with FFT: Step 01
Select inputs
Basic steps to guarantee a proper acquisition of signals coming from accelerometer or microphone for instance.

Rotating analysis with FFT: Step 02
Set a tachometer
The simplest way to set up a tachometer input in NVGate.

Rotating analysis with FFT: Step 03
Display results
How to display and save the relevant results such as signal time history, overall acoustic level, g’s spectrum, tachometer instant value.

Rotating analysis with FFT: Step 04
Analysis settings
How to set FFT and OCT module for typical rotating machine analysis during transient shaft speed.
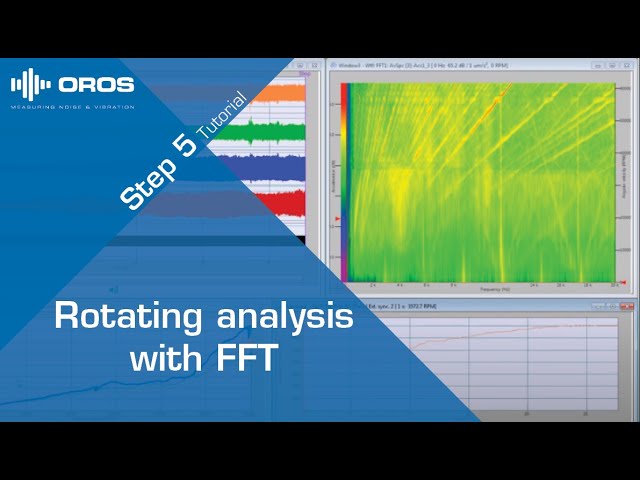
Rotating analysis with FFT: Step 05
Post-analysis setup
How to analyze recorded signal in post-analysis mode.
Rotating analysis with FFT: Step 06
Order extraction
How to extract orders from FFT time-frequency waterfall.
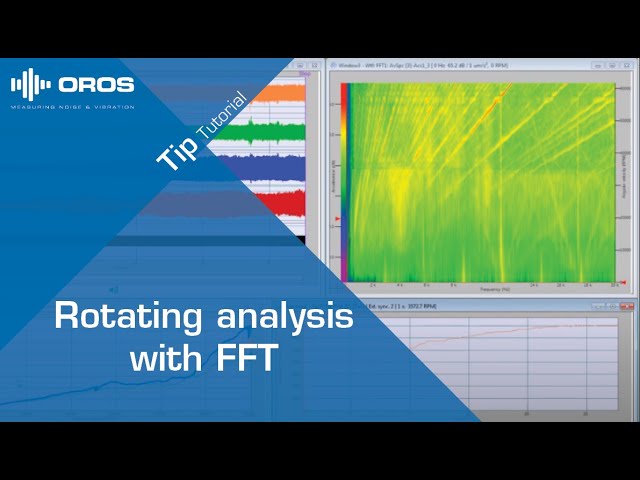
Rotating analysis with FFT: Tip
Create a Delta RPM event
How to create a delta RPM event to reduce the amount of spectra for a long term machine run-up.
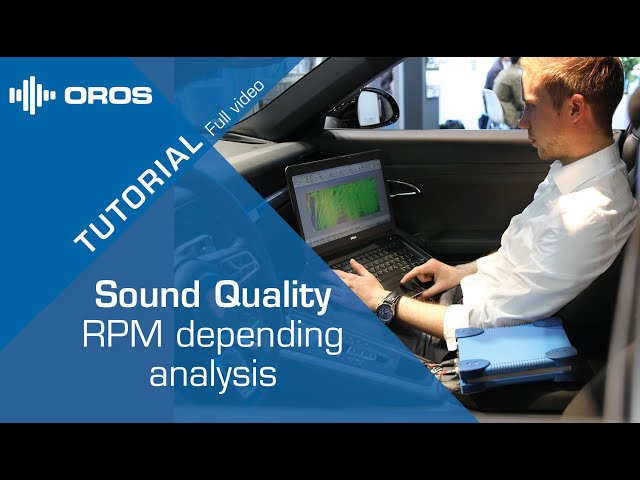
RPM depending analysis
How to do RPM depending display with order cursor. It shows how to generate and post processing tacho signal from FFT spectrogram.
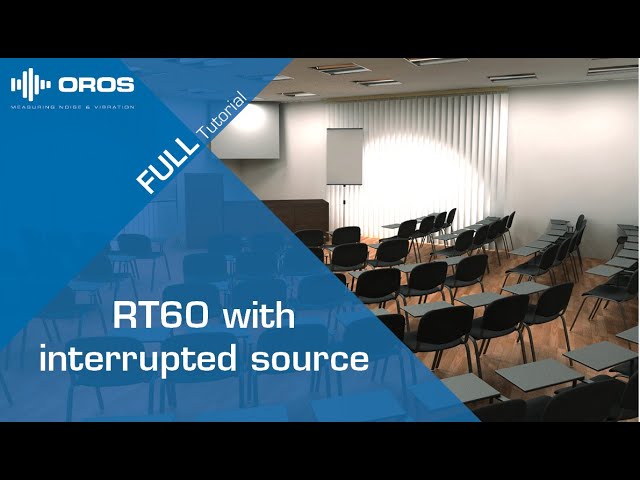
RT60 with interrupted source: Full tutorial
How to build a setup for RT60 measurement using the interrupted source method.
The analyzer output is used to generate a white noise. Thanks to a macro, the whole measurement is automated. It shows how to compute T20 or T30 from the decay curves.
RT60 with interrupted source: Introduction
Different indicators (like T20 and T30) can be computed to determine the reverberation time RT60.

RT60 with interrupted source: Step 01
Select inputs
How to setup the input table with 2 microphones. In this example the 2 microphone are located inside a meeting room.

RT60 with interrupted source: Step 02
Display results
How to display the waterfalls of average 1/n octave spectra on 2 different layouts and how to add them to the saved results selection.

RT60 with interrupted source: Step 03
OCT settings
How to adjust the OCT Plug-in settings to compute 1/3 octave spectra with exponential averaging and a time constant of 20 ms.

RT60 with interrupted source: Step 04
Waterfall settings
The waterfall will collect a spectrum every 5 ms (depending on the sampling frequency). This video shows how to adjust the waterfall depth to collect 1000 spectra.

RT60 with interrupted source: Step 05
Output settings
How to configure the analyzer's output to generate a white noise. The transition time is reduced and the output is muted.

RT60 with interrupted source: Step 06
Customize Control Panel
How to create shortcuts in the control panel to easily change some settings if needed.

RT60 with interrupted source: Step 07
Assign a macro
How to choose a hotkey (F2) to start the macro "RT60_interrupted_source", which will generate the noise, start and stop the measurement.

RT60 with interrupted source: Step 08
Measurement
How the macro is launched using the hotkey. The macro generates the noise, starts the measurement, stops the noise and then stops the measurement.

RT60 with interrupted source: Step 09
Export results
How to export the results in .txt format using the "generate one file per result" option.
RT60 with interrupted source: Step 10
Import results into Excel
How to import the results for each microphone (position) in the Excel computation file for RT60 with interrupted source.

RT60 with interrupted source: Step 11
Axis settings
In the Excel sheet, we identify the time and the amplitude range of interest for the decay curves. The video shows how to adjust all the axis from the Settings tab.

RT60 with interrupted source: Step 12
Calculation mode
The calculation mode (T20, T30 or manual) can be changed for all bands or some bands to get the best fit of the regression lines.

RT60 with interrupted source: Step 13
Report
The RT60 values for each 1/3 octave band and the calculation mode used (T20/T30/m = manual) are displayed in the Report tab, as shown in the video.
Sound design based on auditory spectrogram
How to design sound via innovative editing and resynthesis of auditory representations.
Sound filtering
How to filter sound by a cascade of frequency-based and order-based filters.
It shows how to batch processing multiple signals and how to compare similar sounds by using the distance spectrogram and playback list.

Sound insulation: Full tutorial
How to build a setup for sound insulation measurement and the obtained results in 6 steps.
The OCT plug-in is used. Operators enable to compute the average inside level (microphones 1 and 2) and the level difference between the inside and outside level.

Sound insulation: Introduction
This video explains the measurement setup for sound insulation measurement.

Sound insulation: Step 01
Select inputs
How to setup 2 microphones to measure the level inside the room and 1 microphone to measure the level outside the room.

Sound insulation: Step 02
Sampling frequency
How to adjust the sampling frequency to 51.2 kHz in order to have a bandwidth of 20 kHz.

Sound insulation: Step 03
Display results
How to display the average 1/n octave spectra and the overall levels for all microphones.

Sound insulation: Step 04
OCT settings
How to adjust the OCT Plug-in settings to compute octave spectra from 16 Hz to 8 kHz with linear averaging on 10 seconds.

Sound insulation: Step 05
Create operators
How to create a quadratic average operator and a dB comparison operator to compute the averaged inside level and the level difference between inside and outside the room.

Sound insulation: Step 06
Measurement and results
Average spectra, overall levels and operators are displayed. In the infotrace, it is possible to display the values for specific octave bands using the cursors as shown in this video.
SoundSpot office demonstration
How to post-analyze data measured by SoundSpot to generate acoustic maps and acoustic videos for source localization?
Underwater holography demonstration
How to localize noise sources with acoustic maps
how to quantify and rank sources with sound power, and how to predict noise radiation in the far-field, based on the sound pressure measured by an array close to the test object.
You may also read Underwater sound source localization using Near-field Acoustic Holography (NAH) application note.