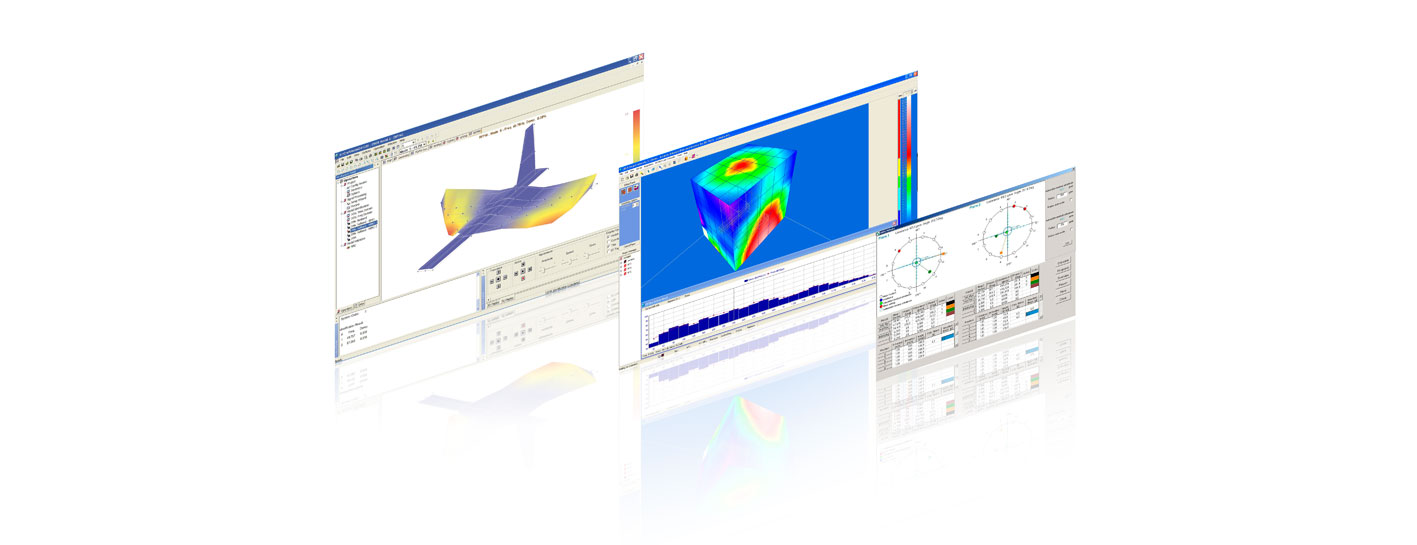


NVGate – the noise and vibration software platform
NVGate is the OROS software platform. It manages instruments’ setup and signal analysis in both real-time and post-processing. NVGate is the link between data acquisition and analysis results. It gathers the basis of noise & vibration measurement backbone with front-end setup, signal processing, calibrations, transducers’ database, live results graphs, reports and measurement automation tools. It holds natively the Teamwork software technology that boost efficiency, security and quality of measurements.
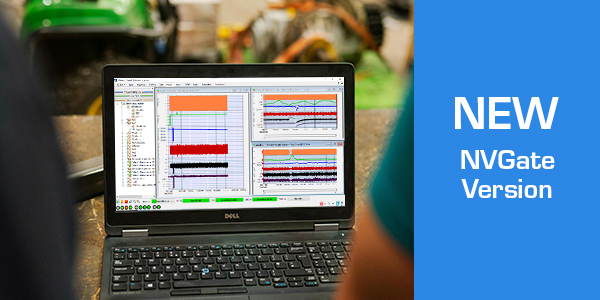
In 2026, OROS released a major new version upgrade to its software platform: NVGate V18, what’s new?
Focus on signals, anytime, anywhere – Monitor
The monitor is an analyzer into the analyzer. It allows hot swapping to any inputs to monitor with live processing:
- Time-levels (DC RMS, Peak, Pk-Pk) with advanced triggering
- Time series (triggers-block)
- Narrow band spectra advanced triggering capabilities
The monitor improves checking the instrumentation, the quality of signal and the measurements reliability.
Up to 4 additional analysis channels run on a dedicated DSP. It enables using the monitor at anytime without disturbing the measurement process.
Catch the right signal - Recorder
The NVGate recorder offers advanced modes to help recording the right data and reducing size. Raw data security backup, signal acquisition with spectral/levels monitoring and transient capture are easily handled:
- On-line recording is managed by a dedicated DSP in the instrument, enabling a gap-free recording simultaneously with the process of other analysis modes
- Recorded files are secured with redundant saves during the acquisition
- In addition to the classical manual Start/Stop and fixed duration acquisitions, the Time-to-Stop records physically a continuously buffered period up to GB of data. Using this mode with a trigger on event signal catch the pre-event raw data rather than recording during hours or days.
- To avoid the boring manipulation of large raw data files, multiple sampling rates can be used simultaneously, 2 user defines (ex acceleration and noise), 1 for parametric inputs (10 Hz) and 1 high for oversampled triggers (6,4 MHz)
Result history - Waterfall and profiles
Spectra, levels, orders and trigger blocks are stacked providing flexible 3D waterfall and powerful 2D profiles. Adapted graphs color-spectrogram, Bode plots, order tracking trend are plotted vs time, RPM, power, torque or any levels and parametric inputs. Adapted cursors and markers offer powerful inspection/comparison tools with cursors linked between multiple graphs.
Sections extract orders frequency bands, max order from colormaps/waterfall results. Profiles are automatically averaged to provide representative results from multi-runs.
Complete tool suite to boost analysis efficiency
Analyze and compare measurements
- Complete set of markers & cursors (linked between graphs & windows)
- Math between inputs on time, angular, spectral and order domains
- Overlay reference results with live measurements
- Mask editor and alarms
User define interface
- Drag, drop and rename any settings in the control panel
- Macros and Excel based sequences allows automating recurrent tasks, routes and rooving
- Models allow recalling pre-defined setups and interfaces
Results broadcasting
- Instant reports to Word/Excel
- Automated company-defined reports for personalized communication
- Multiple import/export formats
Beginner automation access
You can automate your repetitive tasks without any programming skills, thanks to the tools available in the standard interface in the Automation Tab.
- Control Panel: The Control Panel allows to gather all the main control that should be used in production allowing simple touch actions
- Sequencer: especially useful when achieving impact testing for structural dynamics, the sequencer enables to automatically change settings (input labels, node number, direction…) during the measurement sequence. It interacts with MS Excel as providing the text sequence -> Watch the related tutorial from our Download center.
- Macros: this tool offers a global very first programming level access, enabling to automate online and post-analysis (batch post-process, loop of measurements, changes of settings…)
- Masks: Automatic Go/NoGo criteria which is used typically in production >> watch the related video
- Automatic reports: Based on templates or easily build from scratch, reports can be fully automated. A productive alternative to the manual copy/paste of data and graphs!
Time to Stop
The Time to Stop is a unique feature by OROS instruments that records the signal right before an event. In fact, in a mechanical failure, the root cause of the problem can be diagnosed from the vibration signal right before the trigger where it varies rapidly.
Definitely a key vibration diagnostics tool for all vibration analysts!
In 2024, OROS is releasing a major new version upgrade to its software platform: NVGate V18, what’s new?
Previous releases: