


Teamwork software technology
High efficiency software for teams
The OROS software features native technology boosting the efficiency, security and quality of your measurements. Natively embedded in each critical software locations, the Teamwork technology provides a complete environment dedicated to high efficiency analyses.
Handle and share data
Measured and analyzed data benefit from DataSet Management, the native OROS technology for measurement sharing and archiving that boost team exchanges and data security easiness:
- No database, DataSet Management use any Windows or network directory,
- All information gathered within the measurement from project, setup and user,
- Include any file in the measurements; pictures, e-mails, Excel files, pdf, etc…
- Fast feeding properties with automated behavior, user defined
- Direct data mining with efficient filtering,
- Integrated share/collate features with pro merging,
- Secured exchanges with background log files.
Flexible licenses usages
Based on physical keys, the OROS software and hardware licenses offer effective usage with high exchangeability. OROS license management is not dependent from the PC:
- For tests the licenses are hold into the instruments. The instruments are available from any PC. XPod conditioners do not require any key they can be use on any Teamwork instrument.
- Cascading instruments lead to a merge of their licenses. Software modules will be concatenated increasing their channels capability and functionality. The merged licenses operate on any channels of the cascaded configuration.
- For data processing the licenses are hold into dongles, which can be used with any PC.
Rapid & clear setup
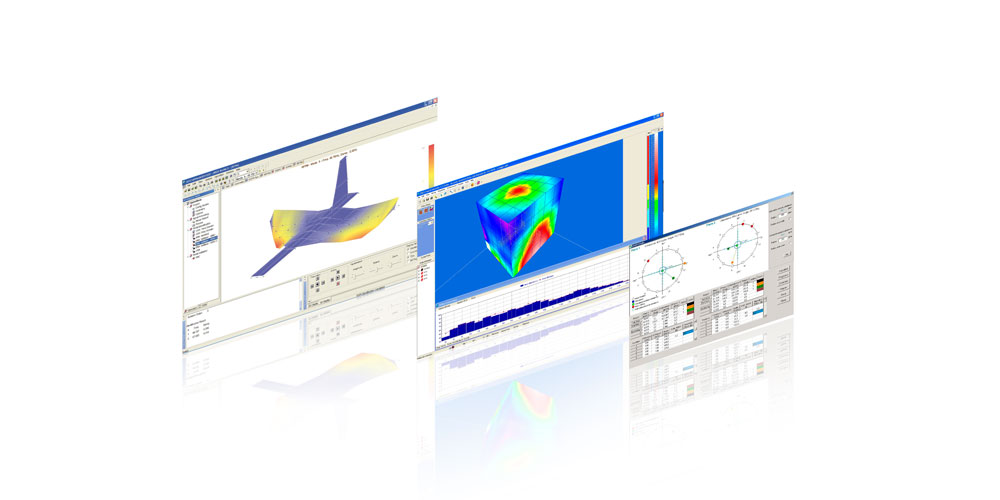
The GoToResult interface drives users through a synthetic measurement setup. GoToResult makes a straight link between physical configuration (geometry, sensors & conditioning) to the results (1, 2 & 3D plots, signal record and multi-analysis) in a minimum of actions. GoToResults overpass the management of inputs number, analysis bandwidth by using the measured physical quantities as group management:
- Inputs selection, an interactive table optimized for keyboard use, provide rapid setup of the acquisition. It friendly manages the multi-sampling clocks from the input’s units.
- Show results, simply drag and drop the results to be analyzed, displayed and saved. Contextual buttons allow accessing the analyses, tachometers, triggers settings.
- Results overview, features a unique table that check and adjust the displayed and/or saved results by physical quantity. It offer being sure of what wil be done after pressing “run”
What is real-time analysis?
The Fast Fourier Transform gives a direct representation of the signal in the frequency domain. This technique computes frequency spectrum and derived results like FRF from time domain data acquired by blocks.
Real-time can have two meanings:
- one, quite obvious, is that you can see the frequency spectrum in live mode, continuously. This is equivalent to an oscilloscope in the frequency domain.
- The second meaning, which is the real meaning, is that the computation takes into account all the time domain data to compute the frequency spectrum. A consequence is that the computation rate has to be faster than the acquisition rate. This is a challenge for FFT analyzers, but a necessary condition to have an exact representation of the signal spectrum. Any loss of time domain data results in an error in the frequency spectrum. The real-time band is then a critical parameter if you want precise measurements.