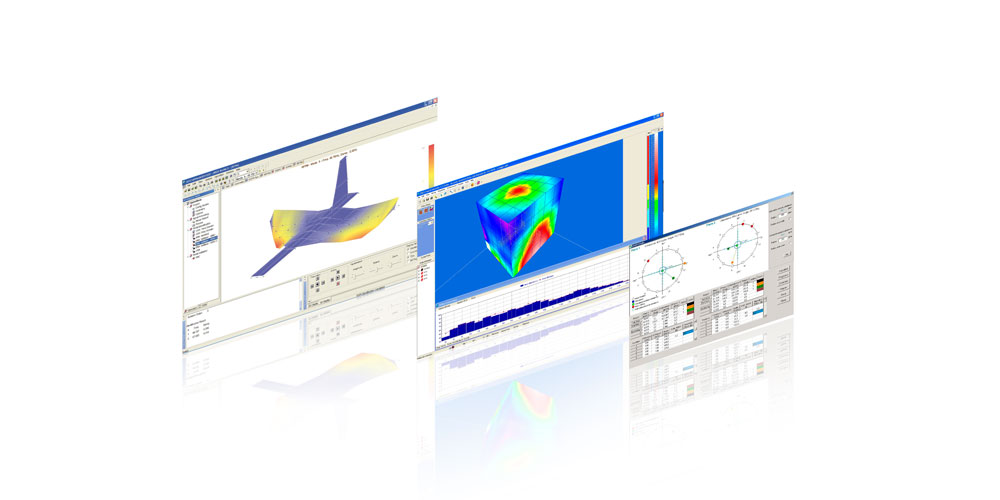


Time analysis and recording
The wealth of signal is not hidden in the spectral content only. The time series hold rich indicators from both the signal envelope and the statistical indicators. The TDA software module offers powerful results to monitor the signal and to extract chocs and vibrations indicators.
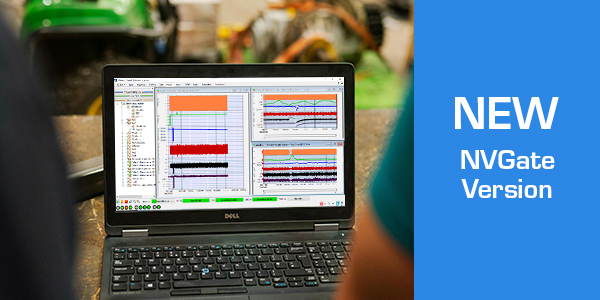
Monitor signals from seconds to hours - Time view
The time view results display the signal envelope on a rolling buffer with a user define time base. The graph can run continuously independently from the other analyses runs/stops offering a great monitoring of the sensor installation.
For advanced monitoring, the signal can be surveyed with different time basis, from seconds to hundred hours, providing simultaneous short-term and long-term views of the signal envelope.
Each graph allows exploring the signal content. A table of statistics is extracted from the selected area of signal. It indicates the averaged DC, Min, Max, RMS, Peak, Pk,Pk, Crest factor and kurtosis levels. Graph can be paused for exploration and return back to the real-time signal.
Extract data signature – Time indicators
The time indicators extracts continuously the signals statistics signature for machinery component defects detection.Time to Stop is a key vibration diagnostics tool, so useful for vibration analysts!
It fits perfectly roller bearing, fluid fame bearing, gear boxes, belt, transmissions parts with its relevant indicators:
-
- DC for gap monitoring, displacement and duty cycle balance
- True* RMS, for vibration/velocity average energy levels
- True* Min & Max for signal envelope
- True* Peak, Pk-Pk, Crest factor for max amplitudes and signal perturbation levels on rotating machinery
- True* Skew to detect chocs direction in the signal
- True* Kurtosis for chocs levels compare to RMS
*Calculated from the time data
All this indicators can be:
-
- Displayed into View meters, digital or analog
- Plotted in profiles Vs any parameters (RPM, Time, Power, etc…) including the other indicators as X axis
- Used to trig the recorder, other analysis as well as stacking results in the waterfall